Tokenomics Insight: When Token Unlocks Actually Move Price
A token unlock increases supply, which is commonly assumed to lower the price. The data supports this for specific unlock types, primarily before the scheduled unlock date. Sample: 236 unique unlock events from tokens above $10M market cap, tracked by Tokenomist, with unlock dates from 16 Jun 2024 to 31 Mar 2026 (price data through 16 Jun 2026), roughly one market cycle. All returns are measured relative to Bitcoin — that is, after Bitcoin's own move is stripped out.
Key Takeaways
- The price drop after an unlock is real but conditional, not a uniform "5% per event." The typical one-month median move is −4.85% compared to matched peers (n=221), but this figure combines two distinct groups and is not constant.
- The effect is concentrated in early-stage, thin-float tokens. The same early-stage cohort shows a median decline of about −16% against similar market cap peers, holding at −14.8% against age-matched peers. Unlocks on established, high-liquidity tokens show no significant effect under two independent controls.
- Most price movement occurs before the unlock date. The one-month pre-event drift is −14.7%, indicating the market prices in the vesting schedule in advance.
- Unlock size, not insider involvement, is the key factor. Of the 77 early-stage unlocks, 73 are large relative to float (value-to-market-cap ≥10%), and 68 are non-insider allocations. Unlock does not mean sold.
72.5% of Unlocks Are Down a Month Later — a Few Explode
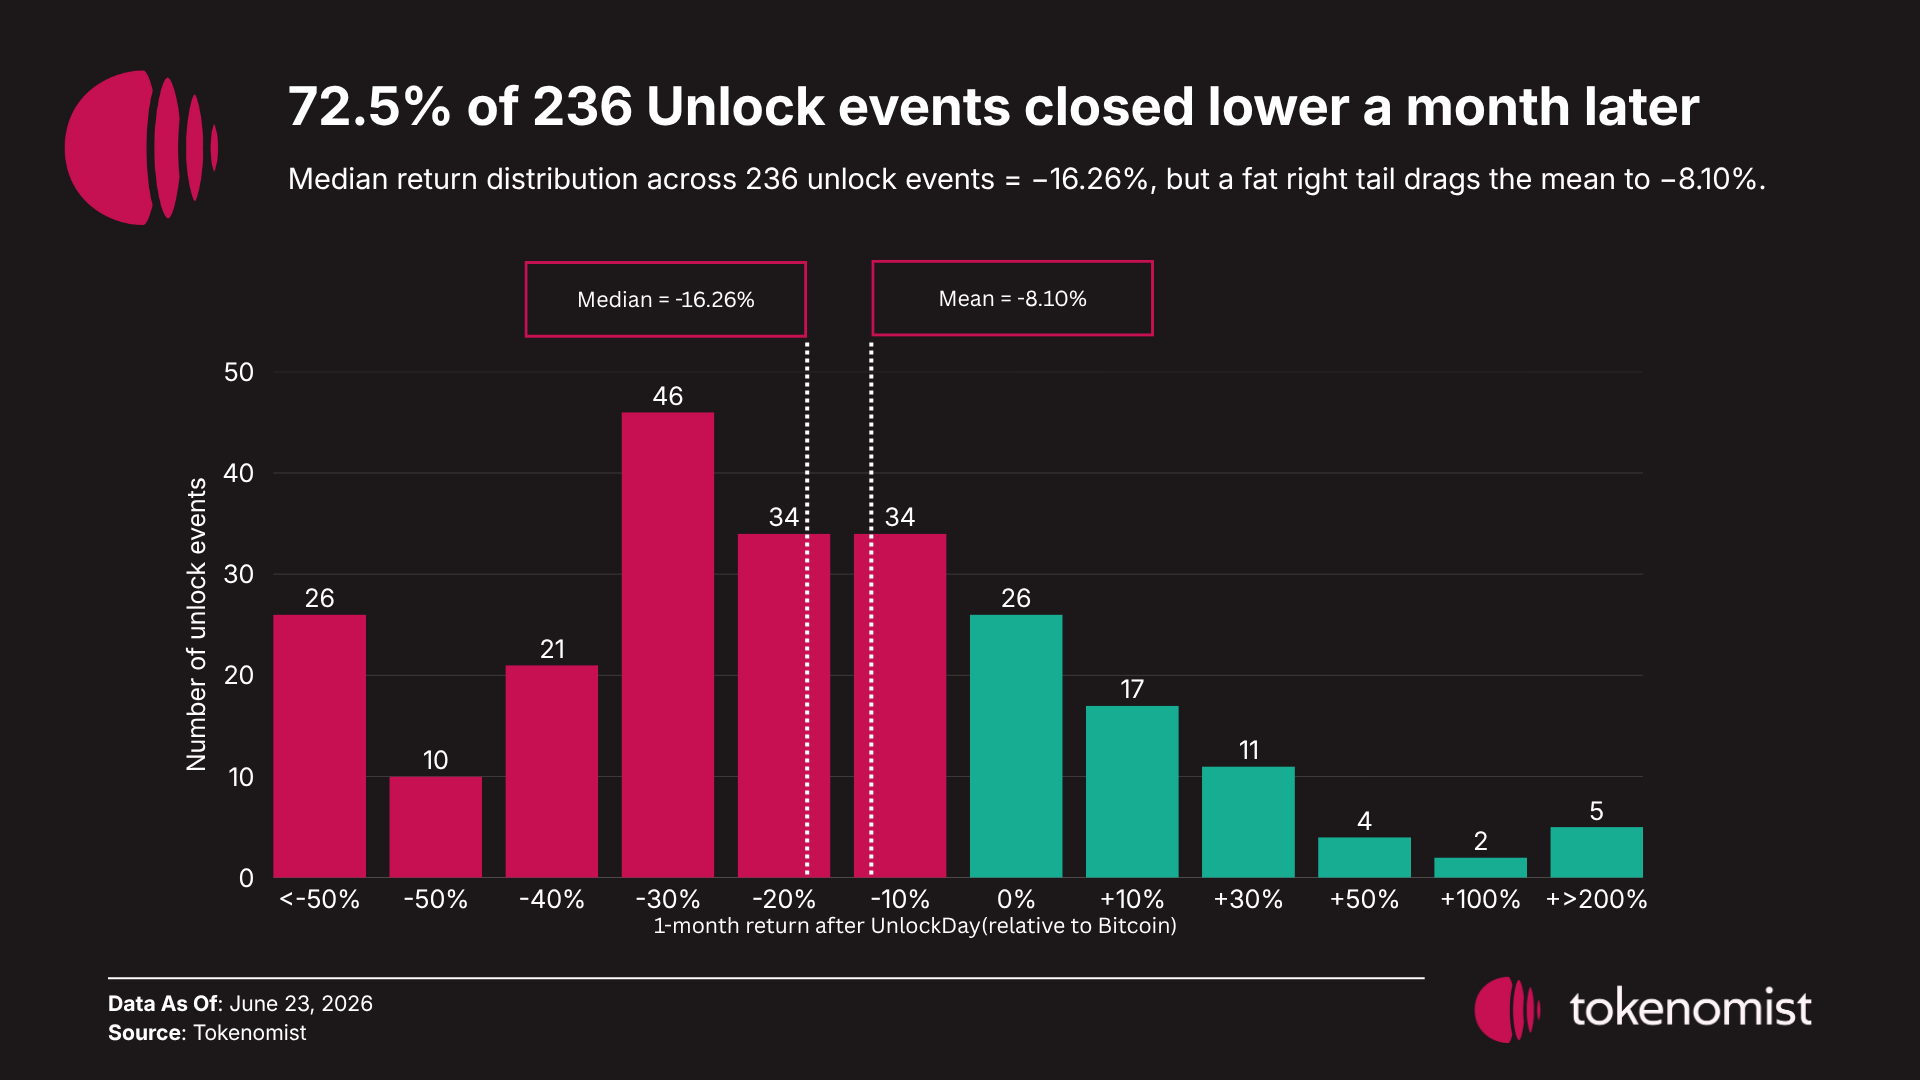
Across 236 unique unlock events tracked by Tokenomist, the one-month raw return has a median of −16.26% and a mean of −8.10%. The difference between mean and median is often misunderstood: the mean is influenced by a few outliers, while the median reflects the typical holder's experience. The single largest cluster of events sits in the −30% to −20% range, and the median −16.26% confirms the typical unlock suffers a meaningful drawdown relative to Bitcoin. A token unlocking into strong demand can appreciate despite increased supply, while one unlocking amid weak demand can lose most of its value. The key difference is the float and demand environment. These are raw, correlational results influenced by broader market conditions, market regime, and the types of tokens scheduled for large unlocks. They describe what occurred around unlocks, not necessarily what the unlocks caused.
Most of That −16% Is Due to the Market and the Token Type, Not the Unlock
The −16% median is often cited as the "unlock effect," but three confounding factors can produce a negative result even without an unlock. The broad market is the largest confounder. Altcoins generally follow Bitcoin, so if a token drops 18% while BTC falls 14%, only −4% is unique to the token. Market regime is another factor: unlocks have different effects in bull versus bear markets due to changes in order book depth. Selection bias also plays a role, as tokens with large unlocks are often early-stage projects that tend to decline after listing for reasons unrelated to the unlock itself. To distinguish real effects from confounds, the study uses multiple layers of controls, each addressing a different dimension and potential bias. Conclusions are accepted only when all controls align.
- Pre-event drift examines price movement ahead of scheduled unlocks, testing whether the market anticipates and prices in the supply event before it happens.
- The within-token placebo compares unlock periods to "quiet" periods within the same token, isolating the effect of the unlock from the token's natural volatility. This control ensures that any observed move is not just business as usual.
- The matched-peer control tracks how the unlocking token performs relative to non-unlocking tokens of similar size, thereby removing broad market effects and testing for an effect unique to the unlock.
- The market-microstructure check compares the observed patterns with well-established theories of supply, demand, and liquidity to assess whether the effect aligns with economic intuition.
- The tradeability test asks whether the measured effect could actually be captured by a cost-effective trading strategy, the line between a statistical pattern and an actionable one.
For most of the sample, this layered approach eliminates the appearance of an unlock effect.

Bitcoin Drives ~48% of Crypto's Moves — So We Measure Against It
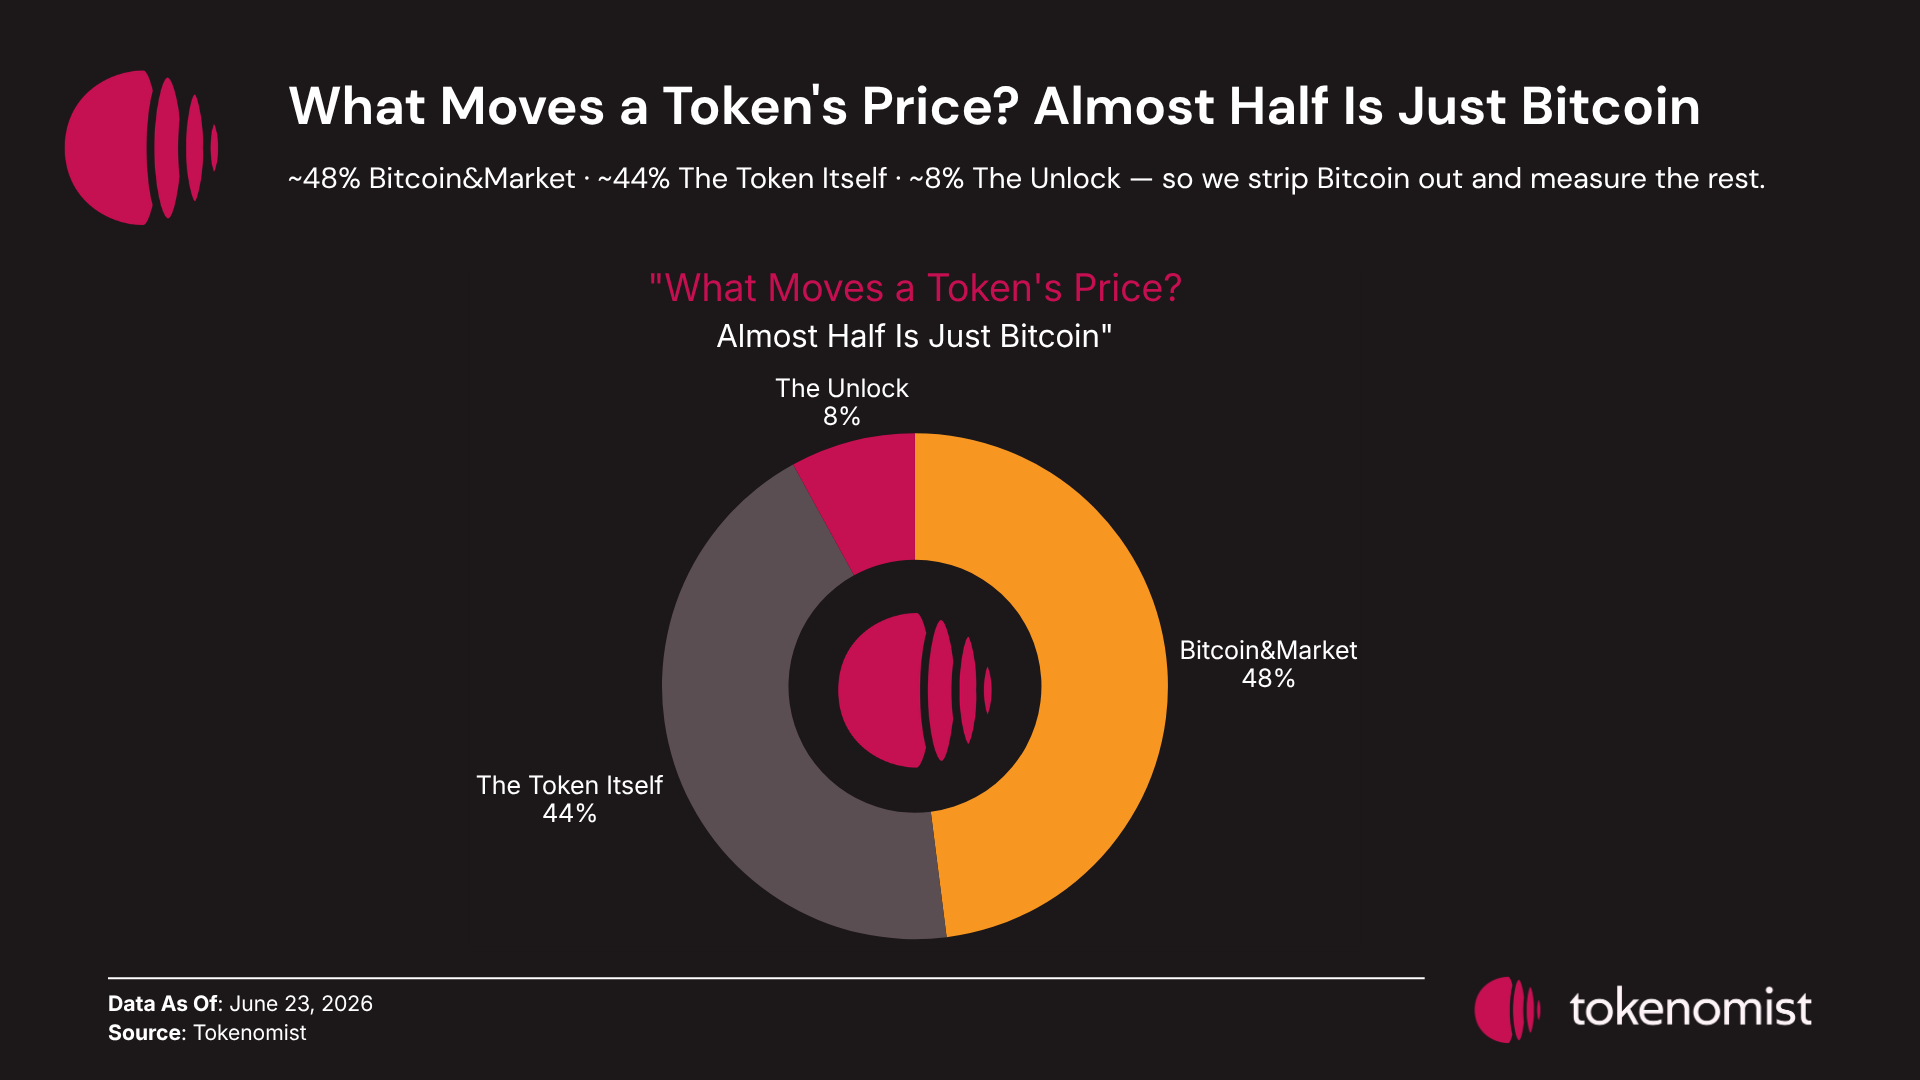
A single market factor accounts for roughly half of the variance in crypto returns. In this sample, the first principal component explains about 48% of the variance, Bitcoin loads more than 76% on it, and BTC–Altcoin correlation runs around 64%. When Bitcoin moves, almost everything moves with it, and that shared move dwarfs most token-specific news. In this context, an unlock is a small, token-specific event that can be overshadowed by Bitcoin's influence. For example, a raw −8% move may reflect −6% from the market and only −2% from the unlock. Subtracting Bitcoin's move isolates the token-specific effect, which is why all results are reported relative to Bitcoin. The adjustment uses a beta of 1 for simplicity and stability, especially for small, early-stage tokens where individual beta estimates are unreliable.
Most of the Decline Happens Before the Unlock Date — a −14.7% Pre-Event Drift
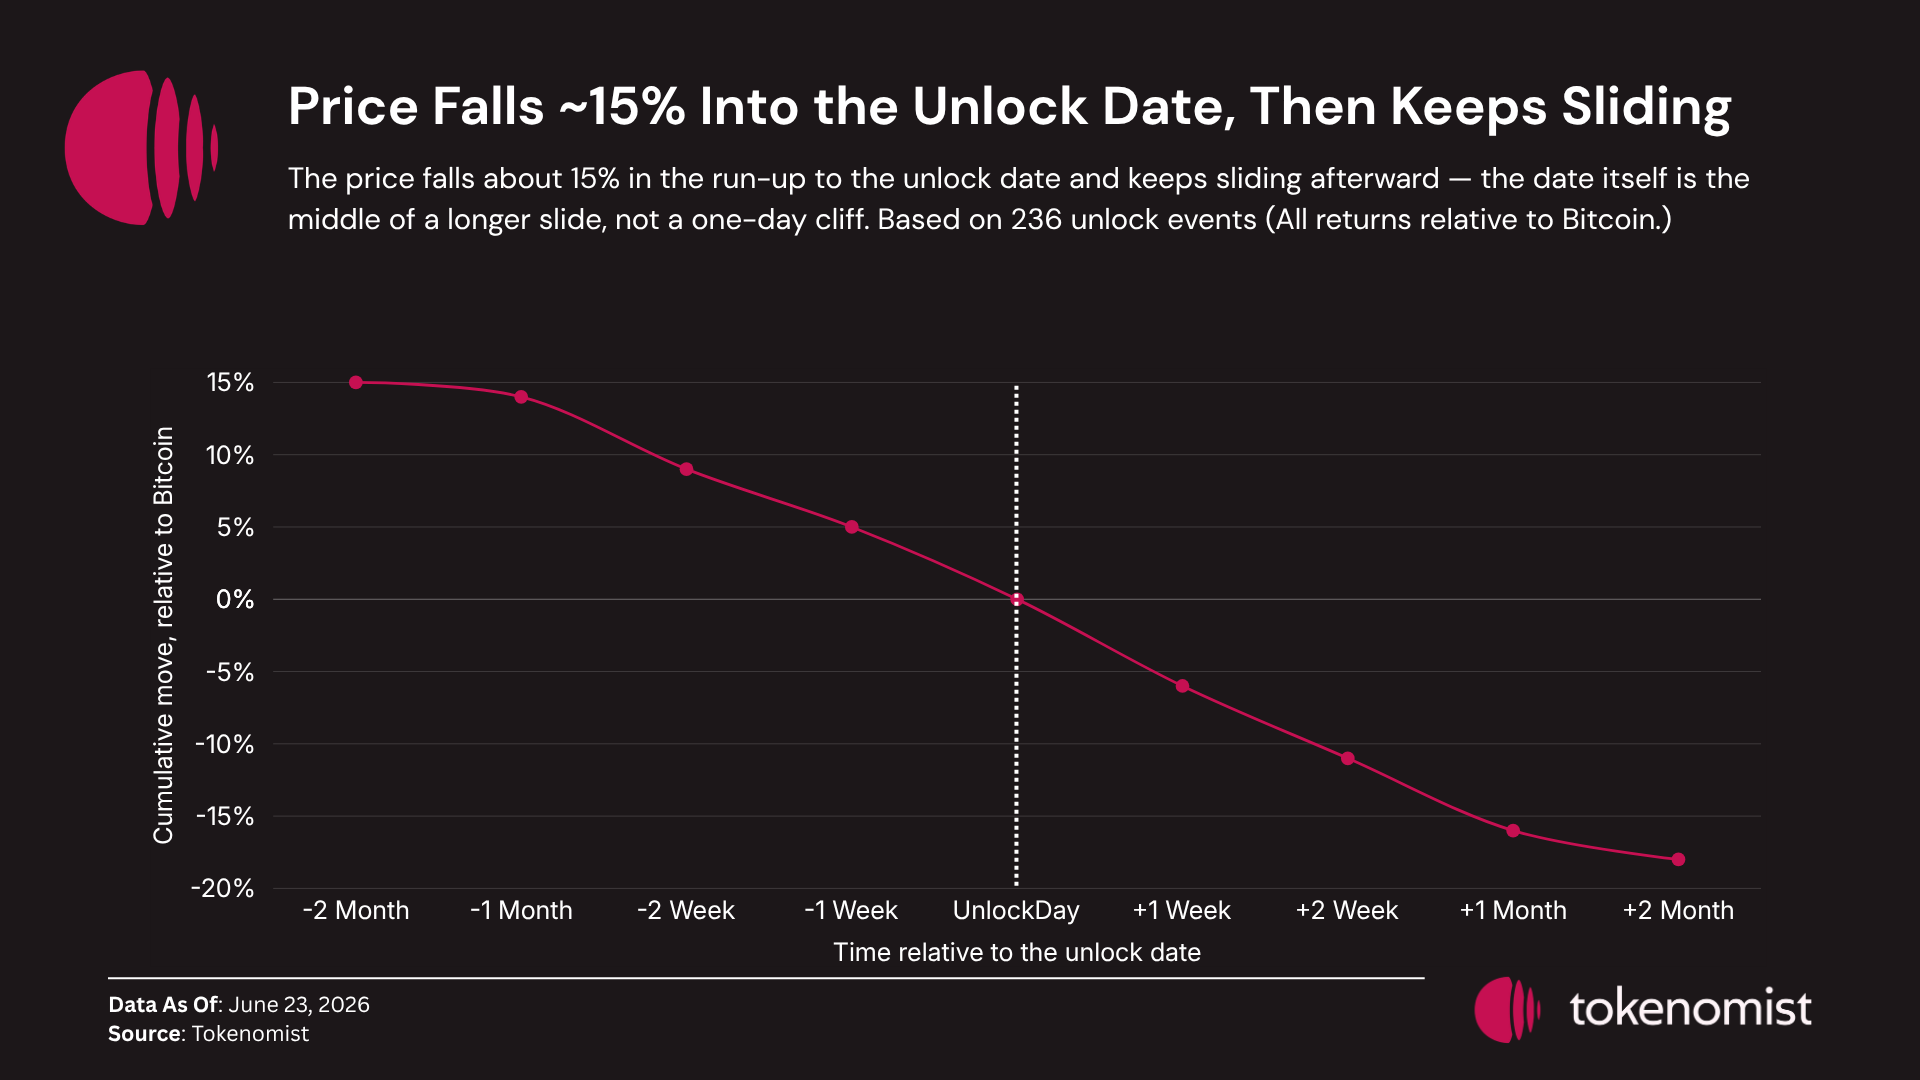
By the unlock date, most of the price movement has already happened. The one-month pre-event median is −14.7% (p < 0.001, n=164), and the two-week pre-event median is −9.1% (p < 0.001). The market reprices tokens well in advance of the unlock: schedules are public — that is the purpose of a vesting calendar — so in an efficient market, the price adjusts to known future supply ahead of time, and the dreaded “unlock-day dump” is usually already in the price. Equity markets show the same drift into IPO lockup expirations even when the date is known. Practically, the main risk window for holders is the month before the unlock, not the unlock day itself.
A Large Unlock Reduces a New Token’s Price by ~15%; Established Tokens Are Largely Unaffected
To isolate what the unlock itself does, each unlocking token is measured against a counterfactual — a stand-in for “the same token without an unlock.” Two independent controls do this, and an effect is kept only where both agree. The within-token placebo — comparing each unlock window to the same token's own quiet windows — finds nothing. The matched-peer control — comparing the token to non-unlocking peers of similar market cap — does find a move, a median −4.85%. But the two disagree because they see different tokens: the within-token test requires a long pre-event history that newly listed tokens lack. Split by history, the −4.85% resolves into roughly nothing for established tokens (median −2.57%) and a real hit for newly-listed ones (median −16.02%). A uniform “−5% effect” is misleading — it overstates the risk for established tokens and understates it for new ones. (Sample sizes, p-values, and confidence intervals for every test are in the Methodology table at the end.)
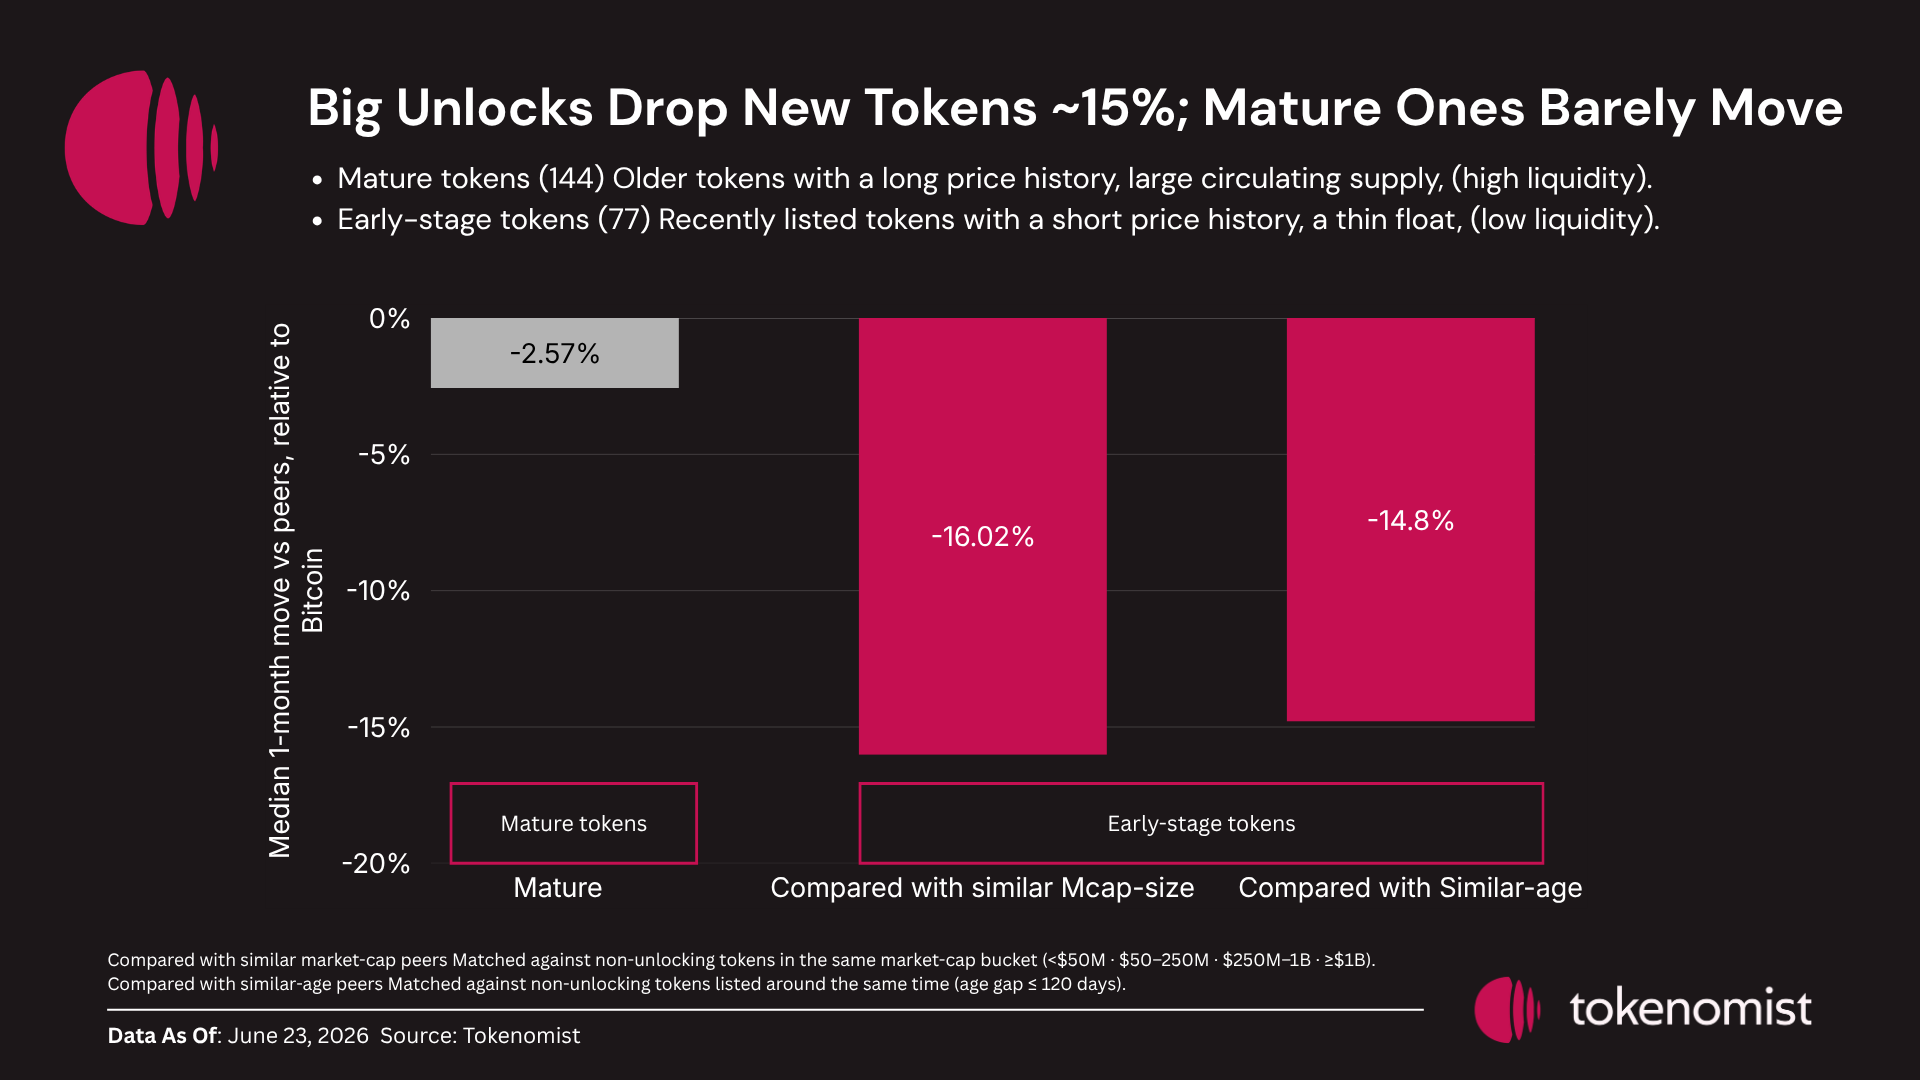
The obvious objection is that early-stage tokens might just fall anyway, unlock or not, and a similar-market-cap peer set won't catch that if the peers are older. So the match was tightened to token age (days since listing), not just market cap: if early-stage tokens simply fall, similarly-aged non-unlocking peers should fall just as hard. They don't — at an age gap of 120 days or less the effect holds at a median −14.8%, while established tokens stay flat. (A tighter 60-day match has too few pairs to resolve — lost power, not counter-evidence.) The effect is heterogeneous: unlocks bite only under specific conditions, set by token type, not by the average event.
Size Drives the Drop, Not Insiders — 68 of the 77 Worst Are Non-Insider
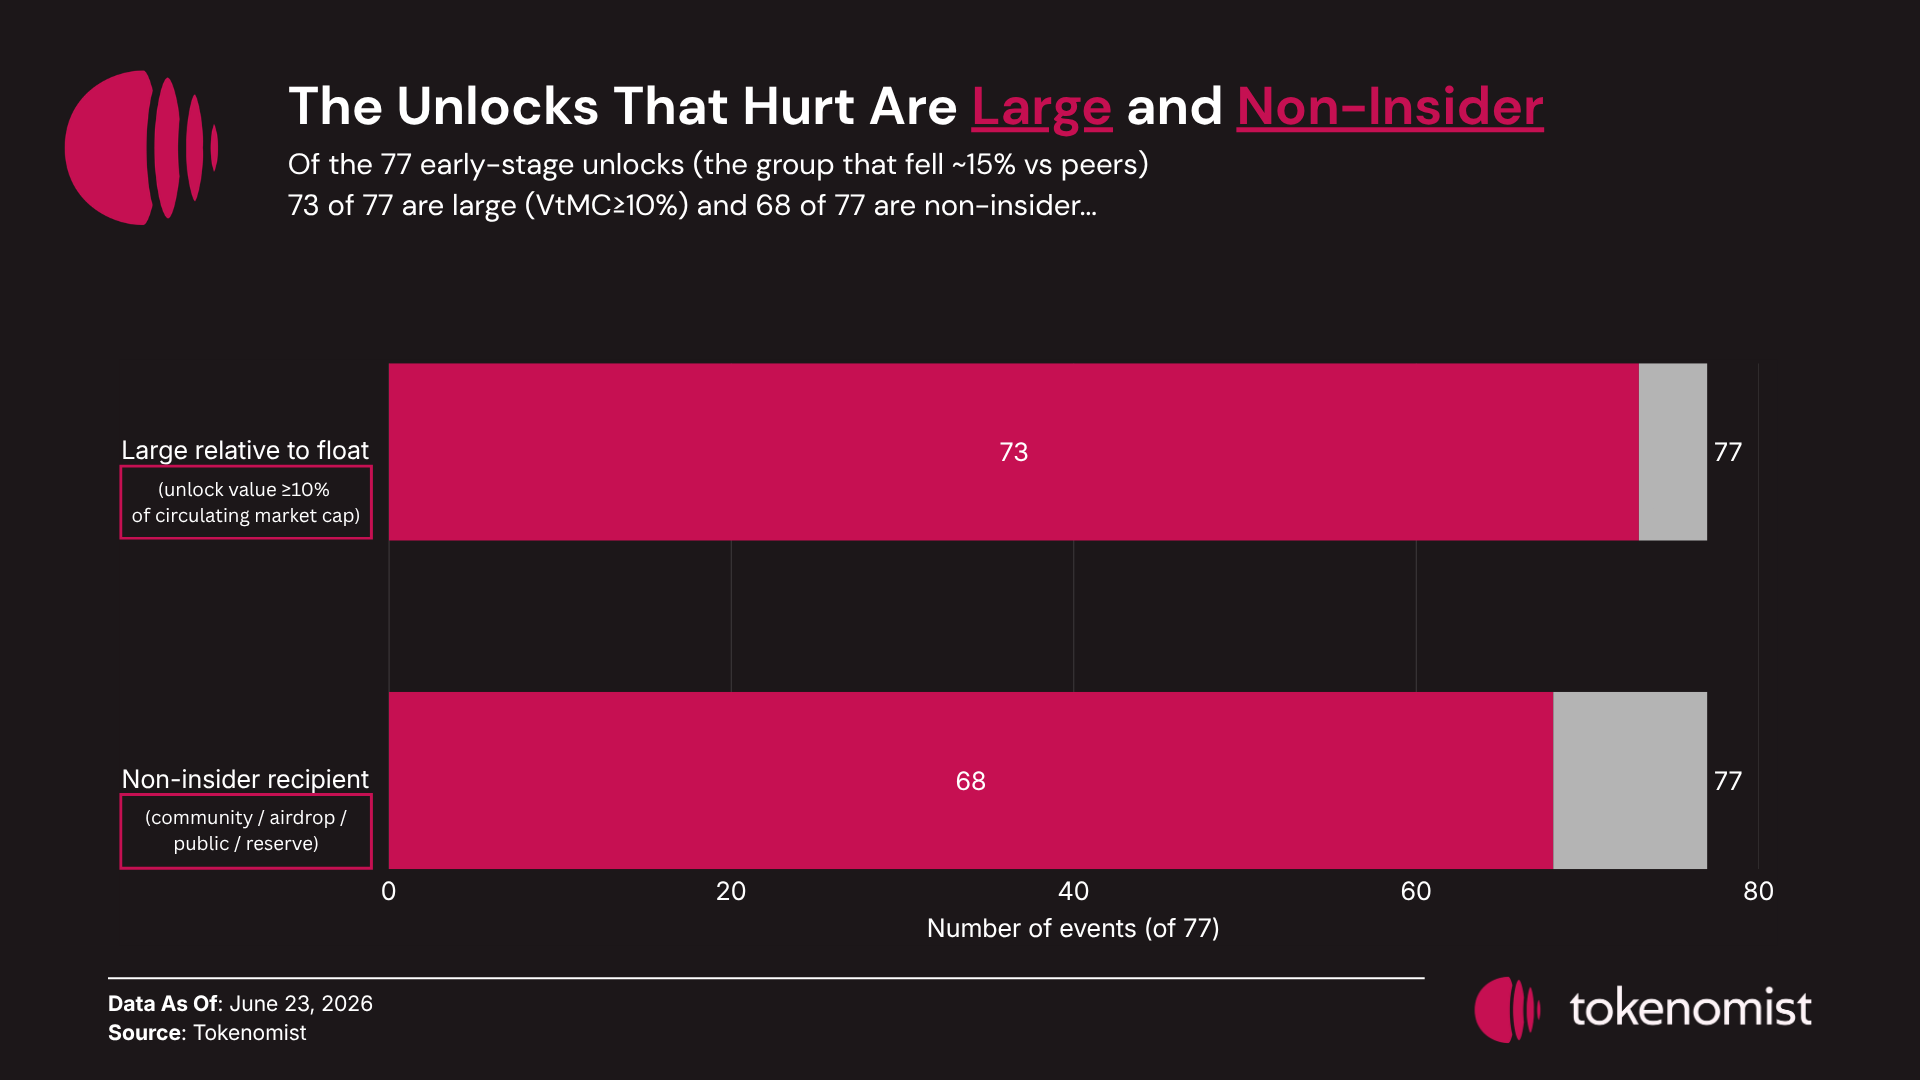
The default narrative reads as insiders cashing out. The composition of the signal-carrying cohort says otherwise. Of the 77 early-stage events that hold the entire controlled effect, 73 are value-to-market-cap (VtMC = unlock value ÷ circulating market cap) ≥10% — the unlock is large relative to the float — and 68 are non-insider. If insider selling were the main driver, the effect would appear in insider tranches. Instead, it is primarily seen in non-insider allocations that are large relative to a thin float. The key variable is unlock size relative to liquidity, not the recipient. Large new supply in the shallow order book of an early-stage token moves price regardless of ownership, while the same unlock in a liquid, mature market has minimal impact. Recipient labels are misleading, as they correlate with outcomes only because some allocation types are typically large and early. For those developing supply-risk tools, flagging unlocks by "insider" status is ineffective. The correct metric is value-to-market-cap for early-stage, thin-float tokens, which best indicates the relative size of an unlock compared to existing liquidity.
Insider = team, founder, and private-investor tranches.
Non-insider = community, airdrop, public, and reserve allocations.
The early-stage cohort already pointed to size and non-insider allocations, not insiders. The same split shows up when you look across every unlock, not just the early-stage few: among large unlocks (≥10% of market cap), non-insider tranches fell a median −26% (n=131) while insider tranches barely moved (−6%, n=44) — the unlocks that actually hurt are big and non-insider. The opposite of an insider-dumping story.
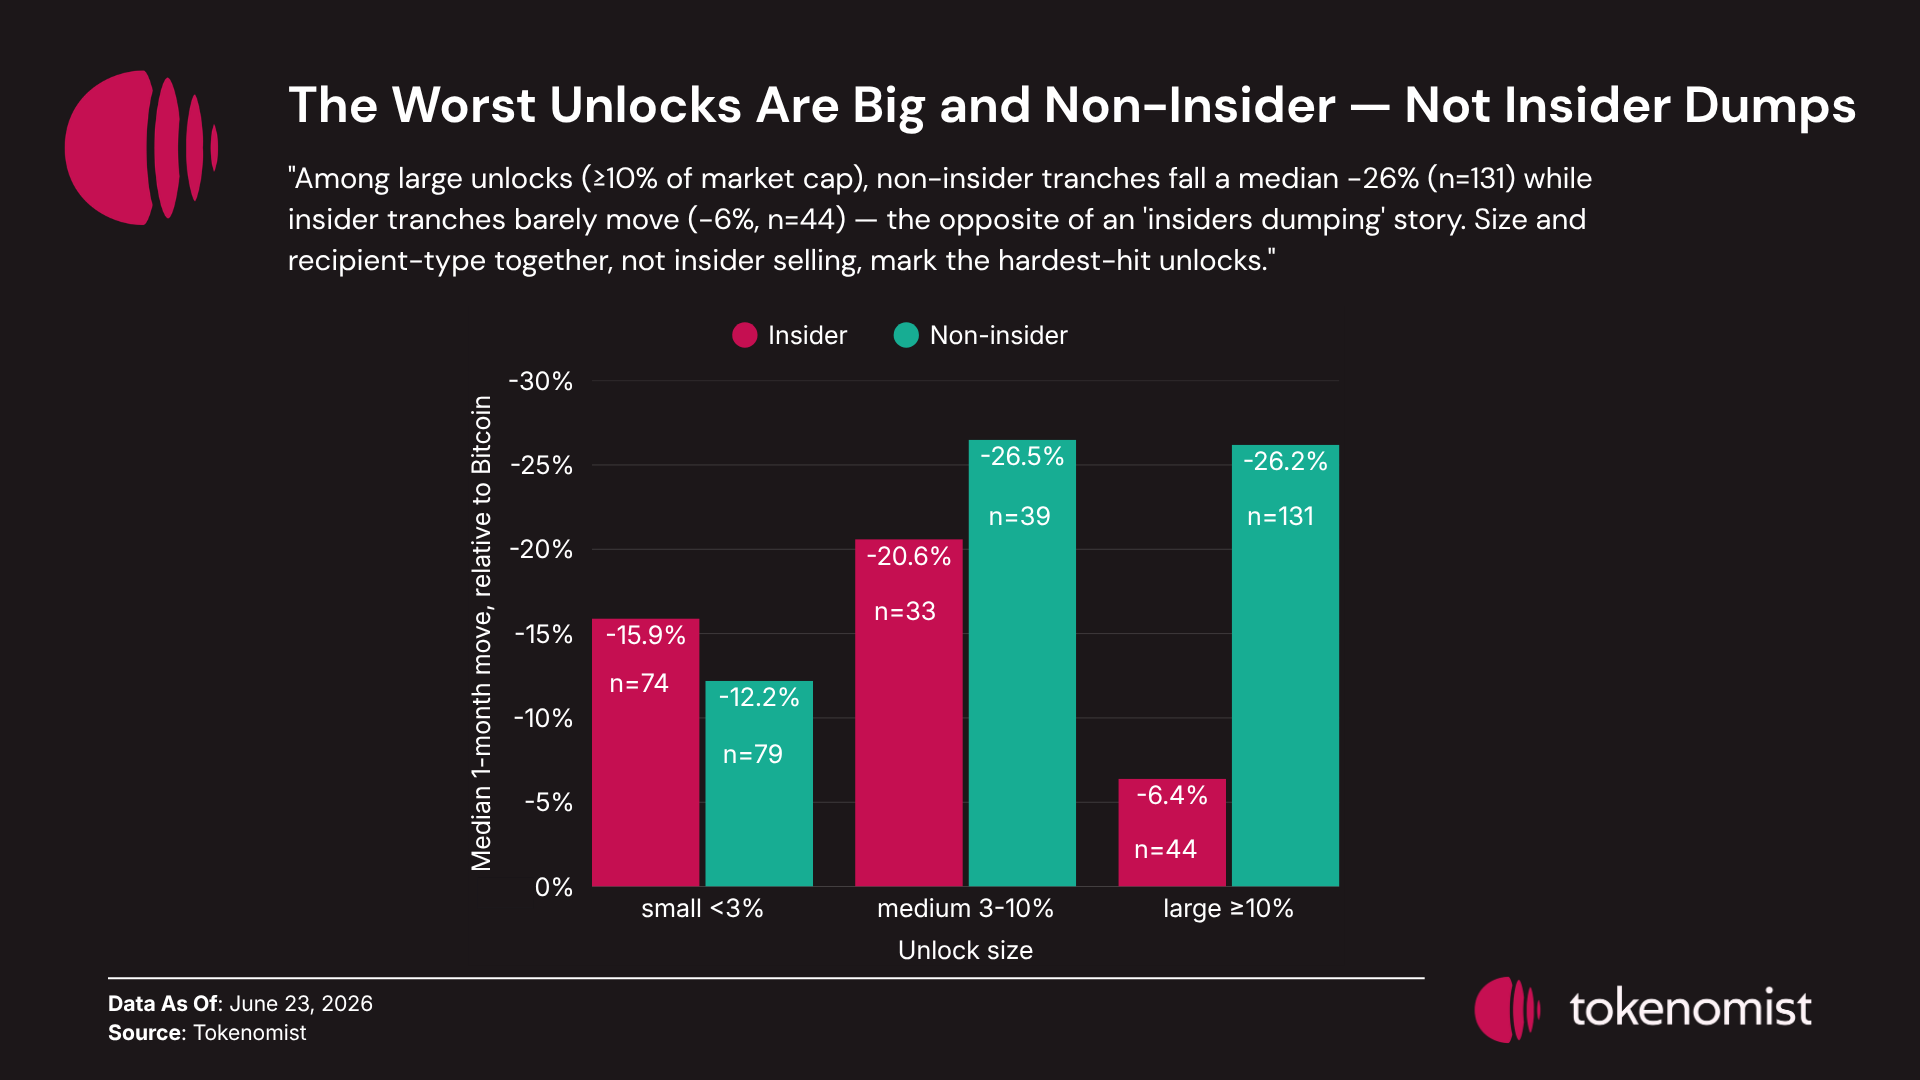
This is a descriptive cross-check, not a causal estimate — raw moves excess of Bitcoin, not peer-controlled — but it points the same way as the controlled result above: unlock size relative to float, not the recipient's label, drives the drop.
Why It Happens: Five Plain Market Mechanics
These findings align with basic market mechanics for a scheduled, public increase in supply. Conditionality, size dependence, pre-event drift, and bear-market amplification are expected outcomes.
- Supply is not absorbed at a constant price. Adding tokens lowers price along the demand curve, and larger unlocks relative to float have a greater impact, as reflected in the value-to-market-cap result.
- Price impact depends on unlock size and liquidity, not the holder. A large unlock in a thin, early-stage order book moves price significantly, while the same unlock in a liquid, mature market has minimal effect.
- A public unlock schedule is anticipated by the market. As a result, most price movement occurs before the unlock date (−14.7%), rather than on the date itself.
- Illiquidity has a greater impact in down markets. The same sell flow causes larger price moves when order-book depth is low, making the effect most visible during bear markets. Therefore, the effect size is not constant.
- A public signal gets crowded out. Once it becomes a known pattern, a widely known signal loses effectiveness as more traders act on it. An unlock calendar is highly public, so any trading edge is quickly diminished.
Whether a tradeable edge survives at all is something this single-cycle study can’t settle. Our window is one market cycle (2024–2026), and the clearest profits are clustered in a single regime. Trading also turns on factors beyond a supply signal — liquidity, borrowing cost, timing, derivatives, and position sizing — that this study doesn’t model. Treat it as an insight from the period studied, not proof the effect can’t be traded; different tools, markets, or timeframes may yield other results.
Four Supply-Side Strategies to Mitigate Unlock-Related Price Drops
The study suggests several remedies. Because price drops are driven by unlock size relative to a thin float on early-stage tokens and are primarily mechanical, the key is to reduce the supply shock relative to available liquidity. These measures do not affect whether holders eventually sell, but they reduce the immediate impact on the order book.
Drip, don't cliff | Release supply in smaller tranches over time instead of one large unlock. | Keeps each event's value-to-market-cap low; because price impact grows less than proportionally with size, many small releases move price far less than one big one. |
Unlock later, into a deeper float | Delay large insider unlocks until the token is more established and liquidity has grown. | The same unlock that hits a new token hard barely moves an established one — a deeper book absorbs it. |
Deepen liquidity before the date | Add exchange coverage and market-making ahead of the unlock. | More order-book depth directly reduces the mechanical price impact, independent of the vesting schedule. |
Offset with demand sinks | Pair the unlock with staking locks, buybacks, burns, or real token utility. | These cut the net new supply reaching the market — but a buyback offsets supply, not price, and must actually be executed. |
All four strategies reduce mechanical supply pressure but cannot create demand. Because the schedule is public, a −14.7% move is already in the price before the unlock date. Structural measures are more effective than last-minute communications.
Conclusion
Token unlocks move price under one condition: when the unlocked supply is large relative to a thin, early-stage float. On established, high-liquidity tokens the effect is negligible, most of the move lands before the date, and the driver is size, not holder identity — so the unlock date itself is rarely the main event. That framework is yours to run today. Every figure here came from the Tokenomist API — unlock events, allocation breakdowns, recipient labels, and vesting schedules: the supply-side data most desks still eyeball from screenshots. Whether you’re sizing supply risk, flagging unlocks by value-to-float, or backtesting your own strategy, this is the data layer to build on.
Every result here comes with an obvious next test. This one spans a single market cycle (2024–2026), so the bear-market case is the natural next test — re-run it across the next regime and see whether the effect holds. The established-token result is the other open question: those names looked largely unmoved by unlocks, but on a thin sample, so read it as "robust so far," not "case closed." A few of our assumptions are deliberately cautious: we date each token’s age from its first recorded price, treat every token as moving one-for-one with Bitcoin, and use price history that only covers tokens still trading — so if anything, the real drops are worse, not milder. Each is a dial you can change and re-run on the same data. What doesn’t move: an unlock is a supply event, and unlock is not circulating, and circulating is not sold.
Let's run backtests with your own assumptions.

Frequently Asked Questions
Do token unlocks always push the price down?
No. Across 236 events, the median one-month move was −16.26% raw, but most of that is the broader market, and the causal effect — what survives controlling for market and peers — is concentrated almost entirely in large, early-vesting unlocks on early-stage, thin-float tokens (a median −14.8% against similarly-aged tokens). Unlocks on established, high-liquidity tokens show no clean effect.
Is the price drop caused by insiders selling?
In this run, the data points the other way. Of the 77 events that carry the controlled effect, 68 are non-insider allocations — community, airdrop, public, reserve. Among large unlocks it’s the non-insider tranches that fall hardest, while insider tranches barely move. The driver is the size of the unlock relative to a thin float, not who receives the tokens. An unlock is supply becoming available — not the same as supply being sold.
When does the price actually move — before or after the unlock?
Mostly before. The one-month pre-event drift is −14.7% because the unlock schedule is public, and market prices reflect future supply before the event date. The unlock day itself is usually the anticlimax.
Can you trade the unlock effect?
That’s a question your own backtest can answer better than ours. The data to run it is one API call away: every unlock event, allocation breakdown, and vesting schedule in this study comes straight from the Tokenomist API — recipient-level, supply-side data you can’t rebuild from a block explorer. The obvious playbook (short against Bitcoin, enter before the date) didn’t clear the bar in our single-cycle test, which is precisely why the edge isn’t crowded. Whatever survives is hiding in the variables we didn’t model: liquidity, borrowing cost, timing, derivatives, and recipient mix. Pull the data and run backtests with your own assumptions. Start with the Tokenomist API →
Can a project stop its unlock from dumping the price?
It can soften the mechanical hit, but it does not guarantee the price. Because the damage is driven by unlock size relative to a thin float, the levers are structural: drip the supply in smaller tranches rather than a single cliff, schedule large insider unlocks later, once the float is deeper, add liquidity ahead of the date, and offset the new supply with staking locks or buybacks. These shrink the supply shock; they cannot manufacture demand, and unlock is not sold.
Methodology & How to Read the Numbers
Every figure here is excess versus Bitcoin — Bitcoin's move is subtracted one-for-one (beta = 1), because a single market factor drives roughly half of crypto's variance. Unlock events, allocation labels, and vesting data come from Tokenomist; daily prices from CoinGecko. Two samples do the work: a descriptive event study of 236 unique (token, date) unlocks, and a causal study of 221 events with a valid matched peer, split into 144 “mature” tokens (≥10 clean pre-event quiet windows) and 77 “early-stage” tokens. Medians are tested with the Wilcoxon signed-rank test, and the load-bearing claim is the matched-peer (Control B) result, checked point-in-time, and against age-matched peers.
| 1 — Distribution | Raw 1-month move vs BTC across all unlocks | 236 unique (token, date) events | Descriptive — the shape, not the cause |
| 2 — What moves price | Variance split: BTC ~48% / token 44% / unlock 8% (PCA; BTC loads >76% on PC1) | Full cross-section | Methodological framing — why we measure vs BTC |
| 3 — Price path | Median cumulative move by window, −2M to +2M | Per-window n varies (e.g. −1M n=164; +1M from 236) | Descriptive; some interpolation between windows |
| 4 — Conditional effect | Causal: within-token placebo (no effect found) + matched peers (−4.85%) → mature −2.57% (n=144, no effect found) / early-stage −16.02% (n=77) | 221 events (144 + 77) | Strongest — controlled, point-in-time; survives an age-matched test (−14.8%, p=0.0012) |
| 5 — Size, not insider | Make-up of the 77 signal cohort: 73/77 large (VtMC ≥10%), 68/77 non-insider | n=77 | Descriptive composition (counts) |
| C — Recipient × size | Raw 1-month move by recipient × size (large non-insider −26%, n=131; large insider −6%, n=44) | Tranche-level | Descriptive only — vs BTC but not peer-controlled; correlational, not causal |
The exact figures behind every test (descriptive rows are measured relative to Bitcoin; the controlled rows are the causal estimates):
| Test | Median +1M | n | p | Note |
|---|---|---|---|---|
| Pre-event drift (−1M) | −14.7% | 164 | <0.001 | descriptive |
| Pre-event drift (−2W) | −9.1% | 166 | <0.001 | descriptive |
| Within-token placebo (Control A) | −1.07% | 158 | 0.47 | no effect found · 95% CI [−4.17%, +5.13%] |
| Monte Carlo placebo | — | — | 0.09 | z = −1.39 · 100k shuffles · no effect found |
| Matched-peer (Control B) | −4.85% | 221 | 0.02 | robust at 30/45/60d (0.009 / 0.020 / 0.008) |
| ↳ established | −2.57% | 144 | 0.42 | no effect found |
| ↳ newly-listed | −16.02% | 77 | 0.03 | the signal |
| ↳ age-matched (≤120d) | −14.8% | 77 | 0.001 | survives |
| Recipient × size (Chart C) | large non-insider −26% · large insider −6% | 131 · 44 | — | descriptive, not peer-controlled |
The reliability ladder: the controlled, causal claim is Chart 4 (within-token placebo + matched-peer + age-matched, all point-in-time). Charts 1, 3, 5, and C are descriptive — they describe what happened around unlocks, not what the unlocks caused — and remain confounded by the market, the regime, and token age. Hard limits: a single market cycle (2024–2026, effectively N = 1 on regime); beta held at 1; token age proxied by the first cached price; survivorship in the price cache (which makes the negatives conservative, not inflated); and roughly 22 simultaneous subgroup tests, so uncorrected subgroup “wins” are treated with suspicion. An earlier version of this work overstated a uniform causal effect; a look-ahead bug was found and fixed, and the narrower conditional finding above survived. Throughout: unlock is not sold.
Sources
- Tokenomist — unlock events, allocation breakdowns, vesting schedules, and emission data across tracked tokens.
- CoinGecko — daily price and market-cap data; all returns are measured relative to Bitcoin.